Supply and Demand Trading on ES & NQ
Mark fewer zones, define the response you need, and know when a retest is no longer worth trading.
Updated 2026-10-31 · 11 min read

Educational content, not financial advice. All worked trades below are hypothetical. Futures are leveraged and involve substantial risk. SATO VIP is my own paid community; neither zones nor backtesting promise results.
Supply and demand trading marks price ranges that preceded a strong departure, then uses a later retest to assess a possible reaction. A demand zone is a potential buying-response area; a supply zone is a potential selling-response area. The useful part is a repeatable location and invalidation rule—not a claim that a candle reveals pending institutional orders.
Supply and demand trading can make a cluttered chart simpler: choose a few ranges, prepare scenarios and wait. It becomes misleading when every rectangle is called institutional demand or every fast move is used to promise a profitable retest. This guide separates a useful planning framework from claims that the chart cannot verify.
What supply and demand trading actually measures
Every executed trade has both a buyer and a seller. Prices change as participants take available liquidity, revise quotes and place or cancel orders. A chart-based supply zone is not an inventory count of everyone who wants to sell; a demand zone is not an inventory count of everyone who wants to buy.
Instead, traders use past price behaviour as a hypothesis about where a future response might occur. A compact range followed by an upward move becomes a candidate demand area. A range followed by a downward move becomes a candidate supply area. The strength of the departure is visible; the identity and remaining orders of its participants are not.
Avoid the explanation that the market must return because institutions left orders behind. A candlestick does not establish that. Even if liquidity previously existed at a price, it can change before the next visit. The honest question is whether your defined pattern and response rule have useful results in a test after costs.
Draw a demand zone with rules you can repeat
Start with the base: the compact range preceding your chosen upward departure. Choose in advance whether a base can contain one candle or several, what counts as compact, and how much departure is required. These are strategy settings, not universal exchange definitions.
For a full-range version, use the lowest wick in the base as the lower boundary and the highest wick as the upper boundary. A body-based version may produce a narrower box, but it is a different method. Do not switch between them after a wick passes through the first box and the second one happens to survive.
Label when the zone became knowable. If you require a completed candle outside the base or a break of a prior swing, the zone is not ready before that condition happens. Drawing the zone retrospectively at the perfect turning point hides this delay and makes a backtest look better than a live decision.
Store the original boundaries and formation time. If you later redraw a range, keep the old version in the journal. That small discipline stops a failed zone from being relabelled as a successful one just because the box expanded.
Supply zones: reverse the direction, not the discipline
A supply zone uses a defined base preceding a downward departure. When price approaches from below, the lower boundary is the first edge it reaches; the upper boundary is the far edge. Decide whether you watch the first touch, require a rejection, or wait for a separate confirmation trigger.
An illustrative base at 6,010–6,012 on ES gives a two-point range to monitor on a rally. It does not imply a short at 6,010 or a stop exactly at 6,012. Your actual invalidation might depend on a confirming swing outside the range, while an entry after confirmation may occur back below it.
Separate a zone breaking from a short trade losing. Price can briefly exceed the box, reverse and later fall. That does not rescue a trade whose fixed stop already executed. Record the trade outcome under its original rules rather than the eventual direction of the market.
Supply and demand versus order blocks, FVGs and volume profile
Order blocks commonly select an opposing candle or a narrow range before displacement. A supply-and-demand approach may cover the broader base. They can overlap, but matching rectangles do not make their definitions identical.
A fair value gap describes limited overlap between the first and third candles of a three-candle sequence. It measures a different feature from the base preceding a move. Neither pattern proves that its interval had no trades or contains unfilled orders.
Volume profile records traded volume by price over a selected period. A base can overlap a high-volume area, or departure can pass through a low-volume area, but those observations require the volume data. You cannot infer the actual distribution just from candle size.
Support and resistance are broader labels for potential barriers or turning references. Use whichever vocabulary helps you apply consistent rules, but avoid counting four names for the same range as four independent pieces of evidence.
Choose market context before selecting the zone
A demand retest during an established upward auction is a different hypothesis from buying into a strong downward move. Define whether you trade continuation, reversal, or both. Keep those samples separate; one successful countertrend screenshot does not validate every demand box below price.
Look at where the range sits relative to prior highs and lows, current value and upcoming reference areas. A zone in the middle of balance may offer little distance before the next obstacle. A cleaner-looking box is not enough if the target is already nearby.
Scheduled releases can change execution conditions quickly. Decide whether your method excludes the release window, reduces size, or uses separate rules. A stop distance that looks modest on a calm chart may produce a larger realised loss during rapid repricing.
Keep only the zones relevant to the current session. If there are several nested boxes above and below price, rank them before trading. Otherwise you can always find a rectangle to justify the trade you already wanted.
Fresh zones and repeated retests: hypotheses, not guarantees
Fresh usually means a zone that has not been revisited since formation. Traders sometimes assume the first return is best because resting orders remain there. That is a testable hypothesis, not something the chart proves. Orders may be cancelled, replaced or never have existed under the story attached to the box.
Count tests using a fixed rule. If three small candles repeatedly enter the area, does that count as three visits or one continuous visit? Either definition can be used, but changing it after the reaction makes the data unreliable.
A later retest can break the zone or create a new reaction. Record penetration depth, time spent inside, reclaim behaviour and how much the market moved between visits. Those observations are more useful than a blanket rule that all tested zones are dead or all untouched zones are strong.
Read the response with orderflow
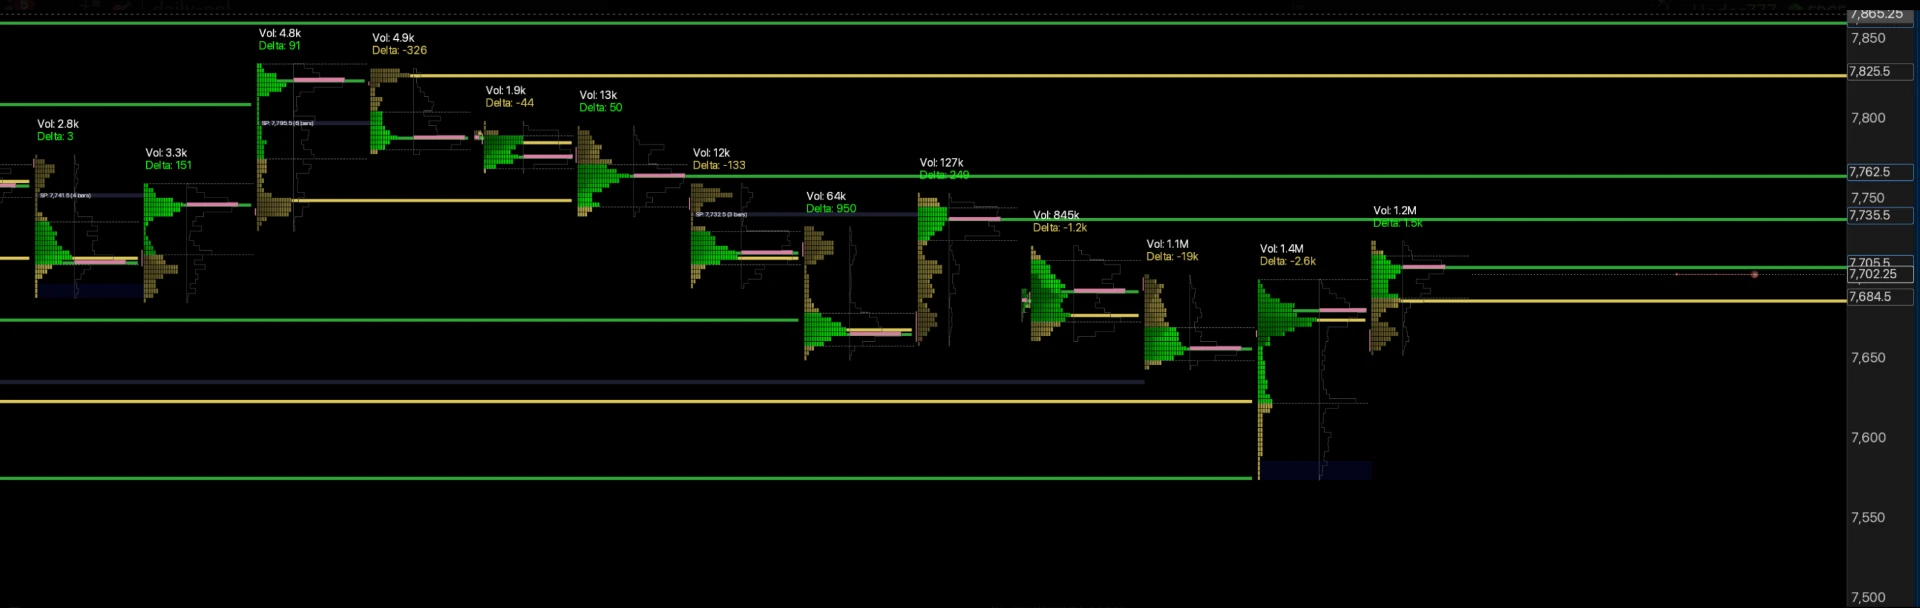
A marked demand zone tells you where to look. Executed selling that stops producing further downside is an observation to investigate. It may be consistent with absorption, but it may also be temporary before price breaks lower. Require the price response specified by your plan, not just a striking delta number.
At supply, aggressive buying can coexist with a failure to advance. Again, that is not automatic permission to short. Can price reclaim and hold above the range? Is the next pullback finding buyers? What would invalidate the rejection idea before an entry triggers?
I use ExoCharts for orderflow and TradingView connected to Tradovate for execution. A chart box does not replace the underlying trade data. The footprint guide explains executed-volume observations, while cumulative delta explains why aggression and direction can diverge.
My VIP preparation supplies daily ES/NQ setups, levels and market bias, not instructions to buy every demand zone. The method I use has been backtested over five years; that does not guarantee future results or establish a win rate for this article’s illustrative zone framework.
Hypothetical ES retest: calculate the trade before entry
Suppose a defined demand base spans 6,000–6,002. Price departs, returns, then satisfies your chosen reclaim condition. The hypothetical entry is 6,002, the stop is 5,999, and an unobstructed planned reference sits at 6,008. Those are invented teaching prices, not a recorded setup.
The three-point stop represents $150 on one E-mini ES contract because ES is $50 per index point. The six-point target represents $300 before costs. That is a planned 2:1 reward-to-risk distance, not a guaranteed two-R result. Commissions, slippage and imperfect fills reduce the outcome.
If confirmation only appears at 6,005, the same stop is six points away and the reference is only three points away. Do not keep the old reward-to-risk label. Recalculate using the actual possible entry and skip when the plan no longer fits.
Equally, if your allowable risk is below the contract’s structural risk, the answer is smaller exposure or no trade—not a tighter stop chosen only to force the numbers. See MES versus ES for the different contract multipliers.
NQ sizing and correlated funded-account risk
At $20 per index point, a hypothetical ten-point stop on one E-mini NQ contract represents $200 before costs. A twenty-point planned target represents $400. Wider point movement does not justify using the same contract quantity as ES; calculate the dollar exposure separately.
On a funded account, work from remaining drawdown, daily limits and the current position rules. The advertised account label is not an amount you can safely lose. Leave room for execution costs and stop slippage rather than budgeting right up to the account floor.
Copying the same idea across accounts multiplies aggregate risk. ES and NQ can also respond to the same news or index move, so two zone trades may be one correlated exposure rather than diversification. My evaluation risk plan covers a practical loss-budget framework.
Journal every qualifying zone, including the failures
Save the formation timestamp, original boundaries, instrument, timeframe, session and context. Record when price first returns, whether your trigger happens, the available entry and stop, and the outcome under fixed exit rules. Include zones that never return within your chosen horizon.
Distinguish a touch from an executable fill. A candle trading at a limit price does not prove your queue position would have filled. Include commissions, reasonable slippage assumptions and missed trades; then review a separate out-of-sample period without refining the rules on that same history.
Common failures are overmarking, chasing late confirmations, changing box boundaries, averaging through invalidation and treating a news-driven break as a routine retest. A useful journal also records correct skips. The goal is a decision process you can repeat, not a gallery of boxes around yesterday’s winning turns.
Sources and limits
CME publishes the contract specifications for E-mini S&P 500 futures and E-mini Nasdaq-100 futures. The contract multipliers support the arithmetic, not the profitability of a chart-zone method.
Supply-and-demand zone definitions are discretionary. This article offers a framework to test, not a statistically validated strategy or a claim that the exchange recognises these rectangles as institutional order locations.
Last updated 2026-10-31. Test a fixed definition and confirm your account’s current rulebook before trading.
Supply and Demand Trading FAQ
What is supply and demand trading?+
It is a chart-based approach that marks ranges preceding directional moves, then assesses price response when those ranges are revisited. The ranges are potential reaction areas, not proof of unfilled institutional orders.
How do I identify a demand zone?+
Under one common definition, mark the compact base preceding an upward departure. Fix whether you use full wicks or bodies, wait for your departure rule to complete, and preserve those boundaries before a retest.
How do I identify a supply zone?+
Mark a defined base preceding a downward departure. The lower edge is the near boundary on an upward retest, while the upper edge is the far boundary. Neither edge guarantees an executable trade.
Are supply and demand zones the same as support and resistance?+
They overlap, but zone methods emphasise the range before a directional departure; support and resistance may be drawn from repeated turning points. Neither label establishes a reliable edge without testing.
What is the difference between an order block and a demand zone?+
An order block usually selects a particular opposing candle or narrow range before displacement. A demand zone can cover a broader base. Definitions vary, so keep each method separate in your journal.
Does a fresh zone always work better?+
No universal rule establishes that. First and later retests may behave differently, but any claim of superiority needs a fixed definition and an instrument-specific sample after costs.
Can orderflow confirm a supply or demand zone?+
Orderflow can show executed buying and selling and the price response at a zone. It adds observations to a trade hypothesis; it cannot guarantee that a zone holds or identify every trader's intent.
Which timeframe is best for supply and demand trading?+
There is no universal best timeframe. Choose a context timeframe and execution timeframe that fit your tested method and available session, and avoid changing them after seeing the outcome.
How much is a three-point ES stop worth?+
At $50 per index point, a three-point stop on one E-mini ES contract represents $150 before commissions and slippage. The eventual loss can exceed that planned amount.
Can I use supply and demand zones on funded accounts?+
Only within the account's current rules, drawdown and position limits. Zone width and remaining drawdown should inform size; a chart pattern does not override news or holding restrictions.