Futures Backtesting: How to Test ES & NQ Strategies
A backtest should try to break your idea, not make it look good. Use this process to test futures rules with realistic assumptions.
Updated 2026-11-19 · 11 min read

Educational guide. I share daily ES/NQ levels and setups in SATO VIP, my paid service. Examples are hypothetical; backtesting and historical reactions do not guarantee future results.
Futures backtesting tests written rules on historical data. For ES and NQ, define the session, contract roll, entry, stop, target and size; include all-in commissions and slippage; avoid future information; then confirm results on data you did not use while building the rules. Treat the result as evidence to investigate, not a promise.
A strategy can look excellent on a chart because you already know where price went. Futures backtesting forces the decision into rules and costs. After that, move to forward practice with my paper trading futures guide.
1. Write rules a stranger could follow
Define the market, contract, session, setup, entry trigger, stop, target, size and maximum trades. “Buy strong support” is not testable. “Buy MES with a limit at the prior day's value-area low after the first 15 minutes, stop 6 points below, maximum two trades” is testable.
Also write the no-trade rules. Missing a trade because of a news filter or daily loss limit is part of the system.
That MES rule is a hypothetical research specification, not my strategy or a recommendation. It is still incomplete until you define the value-area source, what invalidates an unfilled order, when the trade exits and whether the setup can occur again that session. Ambiguity lets you quietly choose the favorable interpretation after seeing the result.
Keep a version number on the rule sheet. Changing a stop, session filter or target creates a new test, not a corrected version of the original result. Record why you changed it and retain the losing runs. Otherwise the final report can hide how many unsuccessful alternatives you tried.
2. Get futures-specific details right
| Item | Why it matters |
|---|---|
| Session | RTH and Globex bars change opens, gaps and indicators. |
| Contract roll | Unadjusted continuous data can show artificial jumps. |
| Point value | ES is $50 per point, NQ $20, MES $5 and MNQ $2. |
| Costs | Commission and fees apply per contract side. |
| Orders | Limit, stop and market orders fill differently. |
Using the wrong point value or session makes every downstream statistic wrong. Before testing, compare the contract maths in best futures to trade.
Record the timezone and how daylight saving is handled. A fixed UTC filter can drift relative to the US cash open during the year. Also decide whether your prior-day references use the full futures session or only regular trading hours. The same entry description can generate different trades if those settings change.
For exact historical price levels, identify the contract month and any continuous-series adjustment. A back-adjusted chart can be useful for long-range research but may move old displayed prices. Do not mix an unadjusted dated level list with a differently adjusted series and call every mismatch a failed level.
3. Charge costs and slippage from the first test
As an illustration, if all-in costs are $0.94 per MNQ side, one contract round trip costs $1.88. Ten such trades cost $18.80 before slippage. A strategy with small targets can lose its apparent edge after realistic costs. See Tradovate fees for a published retail schedule.
TradingView's strategy properties documentation explains commission, slippage and stricter limit-order fill checks. Its default historical limit orders fill when the price is reached. A touch is not always a fill in live trading.
Here is a second, explicitly hypothetical example: a test produces $120 gross across 20 one-contract MNQ round trips. At $1.88 per round trip, fees cost $37.60. If you model one tick of adverse slippage on entry and exit, using MNQ's $0.50 tick value, that adds $20. The result becomes $62.40 before fixed subscriptions, not $120.
Do not claim that one tick is the correct assumption for every market condition. Run less favorable cost scenarios and see whether the conclusion survives. A strategy that works only with perfectly favorable fills is a fragile research result, especially around fast news moves.
4. Avoid look-ahead and chart-type traps
TradingView's look-ahead warning explains how future data can produce unrealistic results. It specifically warns that Renko and other non-standard chart backtests can enter or exit at prices that never traded. If you use alternative bars, read Renko charts explained and validate fills on standard data.
Intrabar order is another trap. With OHLC bars, the tester may not know whether the high or low happened first. Lower-timeframe or tick-based fills can help, but assumptions still need checking.
A bar containing both your stop and target does not by itself prove which filled first. TradingView's Bar Magnifier documentation describes lower-timeframe inspection to improve historical fill precision. More granular data still does not reconstruct your exact live queue position or guarantee a resting limit fill.
Chart selection is a research assumption, not just a visual preference. Use the tick, range and time chart comparison to understand what information each bar groups or hides. Do not optimize on one chart construction and casually execute another without checking the difference.
5. Split development and out-of-sample data
Build and adjust rules on one period. Freeze them, then test a later period you have not studied. Repeated tuning on the same data can fit noise, especially with many parameters.
Review results by year, volatility, weekday, time of day and long versus short. A result driven by one exceptional month needs more scrutiny.
For example, use an earlier block for development and an untouched later block for validation, then move forward through further chronological blocks. The exact split depends on the amount and quality of data. The important property is that the validation period did not choose your rules.
If the later test disappoints and you tune against it, it is no longer untouched. Label it as development data and reserve a new period. There is nothing wrong with improving a strategy; the problem is claiming independent confirmation from data that has already influenced the design.
6. Review the right numbers
- Expectancy after costs: average result per trade.
- Maximum drawdown: deepest equity decline.
- Losing streak: realistic pain before recovery.
- Trade count: enough examples to discuss.
- Rule breaches: compare with your account's limits.
For prop firm accounts, map drawdown and daily-loss behavior with the evaluation risk plan.
Distinguish closed-trade drawdown from intratrade exposure. A trade that eventually wins can experience a large adverse excursion first. A closed-trade equity curve may conceal that path, and a firm's intraday rule can make it decisive. End-of-day and intraday trailing rules need different simulations.
Also distinguish trade count from independent ideas. Copying the same entry across ten accounts is not ten independent strategy observations. Keep the strategy result separate from the account-level fill differences, fees and rule checks. Otherwise a large copied portfolio can make a small research sample look larger than it really is.
7. Discretionary and orderflow backtesting
Discretionary setups are harder to test. Use replay, write your decision before advancing, and capture why you took or skipped the trade. Orderflow concepts need suitable data; standard OHLC bars cannot reconstruct a footprint. Start with orderflow trading explained.
My daily ES/NQ levels are based on a method I describe as backtested over five years. That is context for preparation, not a published audited study or a guarantee.
For a level-based test, keep the dated levels as they existed before the decision. A chart annotated after the move cannot establish that a location was available beforehand. Include failed reactions, no-trade decisions and missed entries, not only screenshots of the clearest reversals. My TradingView levels tutorial covers mapping, which is a separate job from validating a strategy.
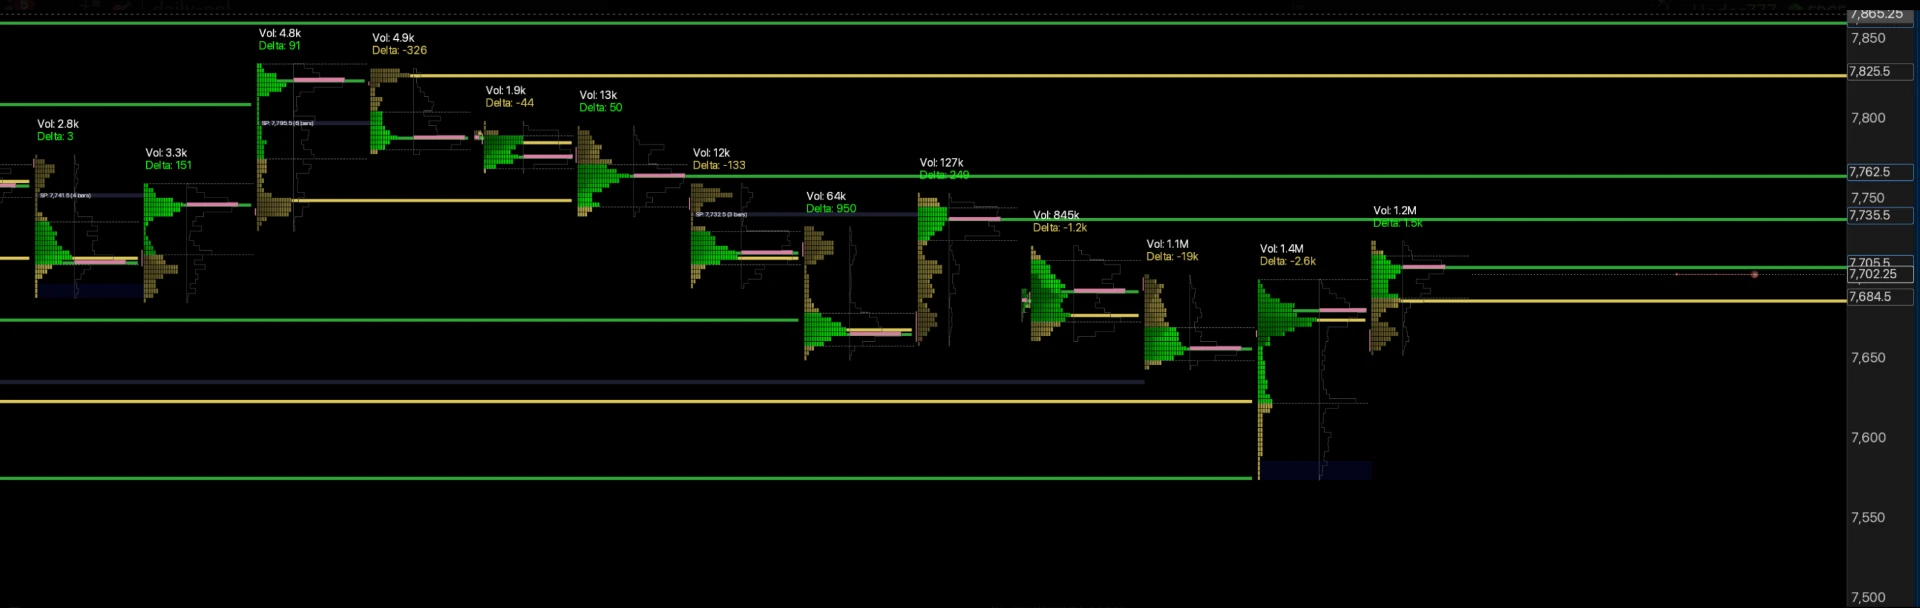
From historical testing to forward practice
Once the rules survive the checks, freeze them for a forward practice period. Log each eligible setup as it occurs, including skips and execution errors. Compare expected and actual simulated fills without rewriting the historical rules to explain every difference.
Manual execution adds decision timing, distraction and hesitation that a coded backtest may not model. Moving from simulation to real money adds further emotional and execution differences. Neither a favorable test nor a clean practice period promises profit or a successful evaluation.
The next step is a better question, not automatically a bigger position: which assumptions were wrong, which trades were actually available and which losses remain acceptable under the account's rules? Use my actual trading setup walkthrough to separate preparation, execution and copying instead of treating them as one backtested process.
Last updated 2026-11-19. Futures trading involves substantial risk of loss. Hypothetical results have limitations.
Futures Backtesting FAQ
What is futures backtesting?+
Futures backtesting applies defined trading rules to historical futures data to estimate how the rules would have behaved. It is research, not proof that the same trades or results will happen in the future.
How do I backtest a futures strategy?+
Write objective entry, exit, sizing and no-trade rules; choose the contract and session; include commissions and slippage; test a development sample; then review an untouched later sample before considering forward testing.
What is the best futures backtesting software?+
The best software is the one that matches your method and data needs. Automated tools suit coded rules, while bar replay suits discretionary practice. Check data depth, contract rolls, order-fill assumptions and costs before trusting any result.
Should I include commissions and slippage?+
Yes. Costs are charged per contract side and add up quickly for active strategies. Slippage matters especially for market and stop orders during fast ES and NQ moves.
Can I backtest on Renko charts?+
Be cautious. TradingView warns that strategy testing on Renko and other non-standard charts can produce unrealistic fills at prices that did not exist. Validate on standard price data.
What is look-ahead bias?+
Look-ahead bias happens when a test uses information that would not have been available when the decision was made. It can make a strategy look much better than it could trade live.
How much data do I need?+
There is no universal number. Use enough history and trades to cover different volatility, trend and range conditions, and keep later data aside for out-of-sample review.
Is manual replay backtesting reliable?+
It is useful for practice and rule refinement, but it can be biased by remembering what happened. Record decisions before moving forward and keep a written rule sheet.
Can backtesting tell me if I will pass a prop firm evaluation?+
No. It can help you study drawdown and risk rules, but execution, emotion, account-specific rules and future market behavior can differ.
Does Sato's backtesting guarantee results?+
No. I describe my level method as backtested over five years, but this is not an audited results study and backtesting does not guarantee future performance.