Point of Control & Value Area Trading
A decision framework for value-edge retests, failed breaks and shifting value—not a rule to fade every line.
Updated 2026-10-25 · 10 min read

Educational content, not financial advice. Futures involve substantial risk. The numerical examples are hypothetical; Sato VIP is my own paid service, not a signal service.
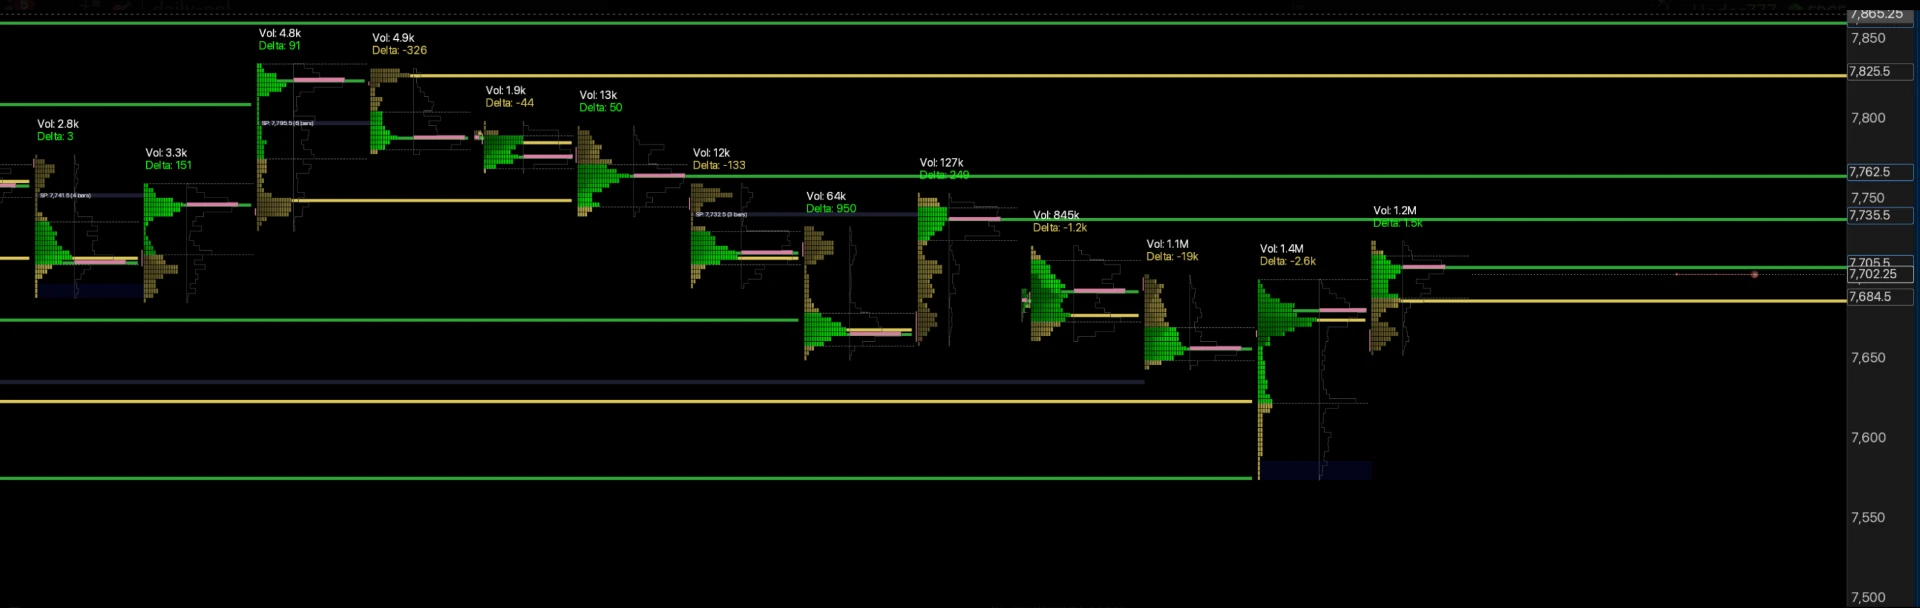
Point of control and value area trading uses the highest-volume price (POC) and the boundaries of a selected volume distribution (VAH and VAL) to organise scenarios. First decide whether price is rotating around established value or building acceptance outside it. A touch of a profile level is a reason to observe, not an automatic entry.
Point of control and value area trading: what the levels actually mean
The volume point of control is the price row with the most traded volume in your selected profile. The value area is a contiguous region that contains a chosen share of that volume, commonly 70%. VAH is its upper boundary and VAL its lower boundary. None of these measures tells you what the next buyer or seller will do.
These are descriptive references, not an estimate of intrinsic fair value. A busy price can reflect two-sided rotation, a large liquidation, or activity during a news event. The same POC may be useful in one session and largely irrelevant after the market reprices.
This guide focuses on the decision at those references: fade, continuation, or no trade. For the chart types, nodes and broader toolkit, start with the volume profile trading guide. For the reasoning behind balance and price discovery, see auction market theory. Keeping those jobs separate stops your chart becoming a collection of unexplained lines.
Fix your profile settings before making a trading plan
A prior regular-session profile and a full overnight-plus-day profile measure different auctions. Choose your session template before the open and write it down. Check the chart timezone, contract month, price-row size, and value-area percentage. Changing the settings after a loss is changing the reference, not improving the read.
An unusually wide row merges nearby prices and can move the displayed POC. A different value-area expansion algorithm can also produce slightly different boundaries. Do not assume a screenshot from another platform must match yours to the tick. Compare inputs before debating the result.
Keep your completed prior-session references separate from today’s developing profile. The completed profile is fixed for that selected period. Today’s POC and value edges can migrate as new trades occur. If you use a composite spanning several sessions, record its start and end; a convenient-looking range selected retrospectively is vulnerable to hindsight bias.
At rollover, compare like with like. A continuous back-adjusted chart can shift historical prices, while the active outright futures contract has its own transactions. Confirm the symbol and data configuration before treating a historical level as an executable price.
The opening location sets the first scenario
An open inside prior value starts with a rotation hypothesis, not a promise of a range day. Ask whether the first moves remain inside the prior distribution or begin building trade beyond an edge. If the open is close to the POC, the immediate reward to the middle may be small; a clean line is not necessarily a useful trade location.
An open above VAH gives two competing ideas. Sustained trade above value can support continuation or a retest from above. A return below VAH, followed by failed attempts to reclaim it, can support a failed-break scenario. The difference is what happens after the opening push, not simply whether price crossed a line.
An open below VAL reverses the same logic. Look for acceptance below value or a reclaim back inside it. After a material overnight move or major announcement, the prior session’s profile may be a weak anchor. Do not force a return to yesterday’s POC when today’s auction is establishing a new distribution.
Acceptance versus rejection: define it before the touch
Acceptance means more than one candle closing beyond an edge. Useful observations include repeated trading outside value, new volume building there, pullbacks holding the boundary, and developing value migrating in the same direction. Those are separate pieces of evidence, not four guaranteed signals.
Rejection is a failed attempt to sustain trade beyond the boundary. Price may probe outside, return inside, and fail to reclaim the excursion. A fast wick alone is weak evidence: it can be an illiquid print, a news reaction or simply an early part of a later breakout.
Define your own operational criteria in replay. For example, you could require a return inside value followed by a failed retest before considering a fade. That is an illustrative rule to test, not an established win-rate claim. Use the same chart aggregation and confirmation rule throughout the sample so the results mean something.
The Market Profile and TPO guide explains time-at-price context. Time-based acceptance and volume-based acceptance are related observations, but a TPO POC and a volume POC do not have to occupy the same price.
Worked ES example: a failed break above value
Use a hypothetical prior-session VAH of 6,000, POC of 5,992 and VAL of 5,984. ES initially trades above 6,000, reaches 6,003, then returns inside value. You do not short simply because price came back below the edge. First check whether the next attempt to reclaim 6,000 fails under your tested confirmation criteria.
Suppose an illustrative short entry is 5,999 and invalidation is 6,003. The structural stop distance is four points. A first reference at 5,992 provides seven points of potential distance, or 1.75 times the stop distance before commissions and slippage. This is a planning example, not a real SATO trade or a recommendation at those prices.
If the retest instead holds above 6,000 and new volume develops outside value, the fade thesis is weakened. A short that was reasonable under rejection is not reasonable under acceptance. Cancel the idea or manage the position according to the plan; do not widen the stop because the old POC looks like a magnet.
VAL at 5,984 is a further reference, not a mandatory target. Decide beforehand whether you take partial profits, trail, or exit at the POC. A target beyond several intervening reaction areas may inflate the advertised reward without improving execution.
Worked continuation example: the edge changes roles
Using the same hypothetical prior profile, imagine price stays above 6,000 and builds a new high-volume area at 6,008. A pullback towards the old VAH may now be a location to assess continuation instead of a place to short. The old edge changes role only if the auction supports it.
For an illustrative long at 6,002 with invalidation at 5,999, the stop distance is three points. A potential reference at 6,008 is six points away. Before entering, check whether the level is reachable without crossing nearby resistance, whether the spread and volatility are normal, and whether the remaining account risk permits the trade.
If price begins sustaining trade back inside old value, the continuation hypothesis needs reassessment. Do not keep calling the move a breakout after its defining condition disappears. The POC, boundary and developing profile organise your observations; they do not override them.
Use orderflow to assess the response, not invent certainty
At a prepared edge, a footprint can show heavy aggression with little price progress. Cumulative delta can show whether buying or selling aggression is accompanying the move. Neither proves that a particular institution is defending the boundary. Absorption can persist before the resting liquidity is finally exhausted.
For a rejection idea, ask whether aggressive trades outside value fail to produce further progress and whether price then returns to the planned side. For continuation, ask whether the retest holds and price resumes progress. Waiting for evidence can worsen the entry price, so include that trade-off in your testing.
I use ExoCharts for orderflow and execute through TradingView connected to Tradovate. That is my actual workflow, not a claim that these profile scenarios are the exact liquidity levels I publish. My daily VIP preparation is my own HTF and intraday ES/NQ levels, setups and market bias—not a standard POC/VAH/VAL signal package.
See my daily ES & NQ trade setups and preparation if you want to understand the paid offer. Keep the distinction clear: this guide teaches profile references; VIP shares my own analysis, with your entries and risk remaining your responsibility.
The cumulative delta guide explains divergence limitations, and footprint charts explained covers bid/ask reads. Use a tool only if it changes a specific decision at a location you selected beforehand.
Risk, no-trade conditions and a review checklist
Put invalidation where the scenario is wrong, then calculate position size. Do not select a tiny stop merely to make a rotation to the POC look attractive. If the structural stop is too wide for your risk budget, reduce size or skip. A profile does not grant extra room inside a prop firm’s drawdown.
Skip when the open is too close to the intended target, when price is alternating across the boundary without a stable read, when a scheduled event is imminent, or when your data/session settings are uncertain. Also skip when your confirmation arrives after most of the planned distance has already travelled.
For review, record the opening location, selected profile period, hypothesis, evidence required, invalidation, potential target, execution costs and eventual outcome. Separate rejection and continuation trades; pooling them together can hide why one scenario loses. Screenshot the profile before entry so a later developing POC cannot rewrite the original plan.
Begin in replay or simulation using paper trading futures. Judge the full distribution of wins, losses and missed trades rather than a few perfect rotations. No fixed percentage return-to-value rule is a substitute for your own tested sample.
Want to review location and confirmation 1:1?
In 1:1 mentorship we work on my preparation, orderflow process and risk decisions—not a promise of evaluation passes or profitable pattern signals.
Explore 1:1 MentorshipBring a Clearer Plan to Your Next Session
Get my ES & NQ trade setups, orderflow levels and market bias inside Sato VIP. You control confirmation, execution and risk.
Daily preparation and context — not trade signals.
Last updated: 2026-10-25. Test the definitions with consistent data and account for execution costs.
POC & Value Area Trading FAQ
What is point of control trading?+
It uses the highest-volume price in a selected profile as a context reference for rotation, targets or acceptance. The POC alone is not an entry signal.
What do VAH and VAL mean?+
VAH is the upper boundary and VAL the lower boundary of a selected value area. Their prices depend on the profile period, row size, percentage and calculation method.
Does price always return to the POC?+
No. Price can establish value elsewhere, especially in directional sessions or after new information. A previous POC is a reference, not a guaranteed magnet.
Should I buy VAL and sell VAH?+
Not automatically. That is a rotation hypothesis to test in balanced conditions. Acceptance beyond an edge can invalidate the fade idea.
Is the value area always 70%?+
Seventy percent is a common setting, not a law of markets. Platforms can allow other percentages and use different boundary-expansion algorithms.
Why do my POC levels differ between platforms?+
Check the session, timezone, contract month, data, row size and profile calculation settings. Different inputs can produce different levels.
What is a developing POC?+
It is the highest-volume row in an unfinished profile. It can shift as additional trading occurs; a completed profile is fixed for its selected period.
Is volume POC the same as TPO POC?+
No. Volume POC measures traded volume per row, while TPO POC measures time-period occurrences. They can coincide but need not.
Can I use these concepts on ES and NQ?+
Yes, with consistent futures data and session settings. Confirmation, volatility, contract risk and execution costs still need to be considered separately.
Does Sato VIP provide POC and value-area signals?+
No. Sato VIP shares Sato’s own daily HTF and intraday ES/NQ liquidity levels, setups and bias. Members decide confirmation, execution and risk; it is not a POC/VAH/VAL signal service.