The Best Indicators for Futures Trading: What Each Tool Does
An ES and NQ toolkit organised by location, confirmation and volatility—not a ranking of magic buy-and-sell signals.
Updated October 16, 2026 · 11 min read

Educational comparison with links to Sato's paid VIP and mentorship offers. This is an editorial toolkit, not a performance ranking or financial advice. Futures trading involves substantial risk; no indicator guarantees an edge.
The best indicators for futures trading answer different questions. VWAP and volume profile help frame location; cumulative delta and footprints examine executed aggression; moving averages summarise trend; ATR helps describe volatility. Start with a small, understandable toolkit and a separate risk plan, rather than stacking indicators until they all say buy.
Searching for the best indicators for futures trading often leads to a chart covered in lines and oscillators. The problem is not a shortage of tools. It is a shortage of clearly defined decisions. Before adding anything to an ES or NQ chart, decide whether you need help finding a location, assessing a response or understanding volatility.
Best indicators for futures trading: the comparison
This is a comparison by purpose, not a claim that one indicator outperforms another. There is no tested return ranking here. Several tools can be useful within a defined strategy and harmful when treated as automatic instructions.
| Tool | Main use | What it cannot tell you |
|---|---|---|
| Session VWAP | Volume-weighted session reference | Whether the next touch will hold |
| Volume profile | Where selected-period volume traded | Where unfilled orders currently rest |
| Cumulative delta | Net classified trade aggression | Future direction or trader identity |
| Footprint | Executed volume at individual prices | Guaranteed absorption or reversal |
| Moving averages | Smoothed trend and price relationship | A leading prediction of the next move |
| ATR | Recent range-based volatility | Direction or an account's safe position size |
| RSI | Relative strength of recent price changes | A compulsory reversal at an extreme |
Notice the distinction between location tools and response tools. A profile can show where activity concentrated. A footprint can show what traded when price returned. Asking both to predict the next candle sets them up to disappoint.
VWAP: a session reference, not a compulsory bounce
VWAP means volume-weighted average price. It weights prices by traded volume over the selected accumulation period. A session VWAP starts from a session boundary; an anchored VWAP starts from a chosen event or point on the chart.
For intraday futures, the useful question is how price behaves relative to that reference. Is it holding on one side, repeatedly rotating through it, or moving away after a meaningful test? Those observations can help distinguish context. A bare cross does not tell you whether the move has room or whether your stop is sensible.
Session settings matter. A VWAP including overnight activity is not the same calculation as one starting at the cash open. An anchored version also depends on your anchor choice. Select that choice for a reason before the trade rather than moving the anchor until it explains the chart.
The VWAP trading strategy guide covers the broader decision process. The main mistake to avoid is treating every departure from the average as something that must immediately mean-revert.
Volume profile: find activity by price
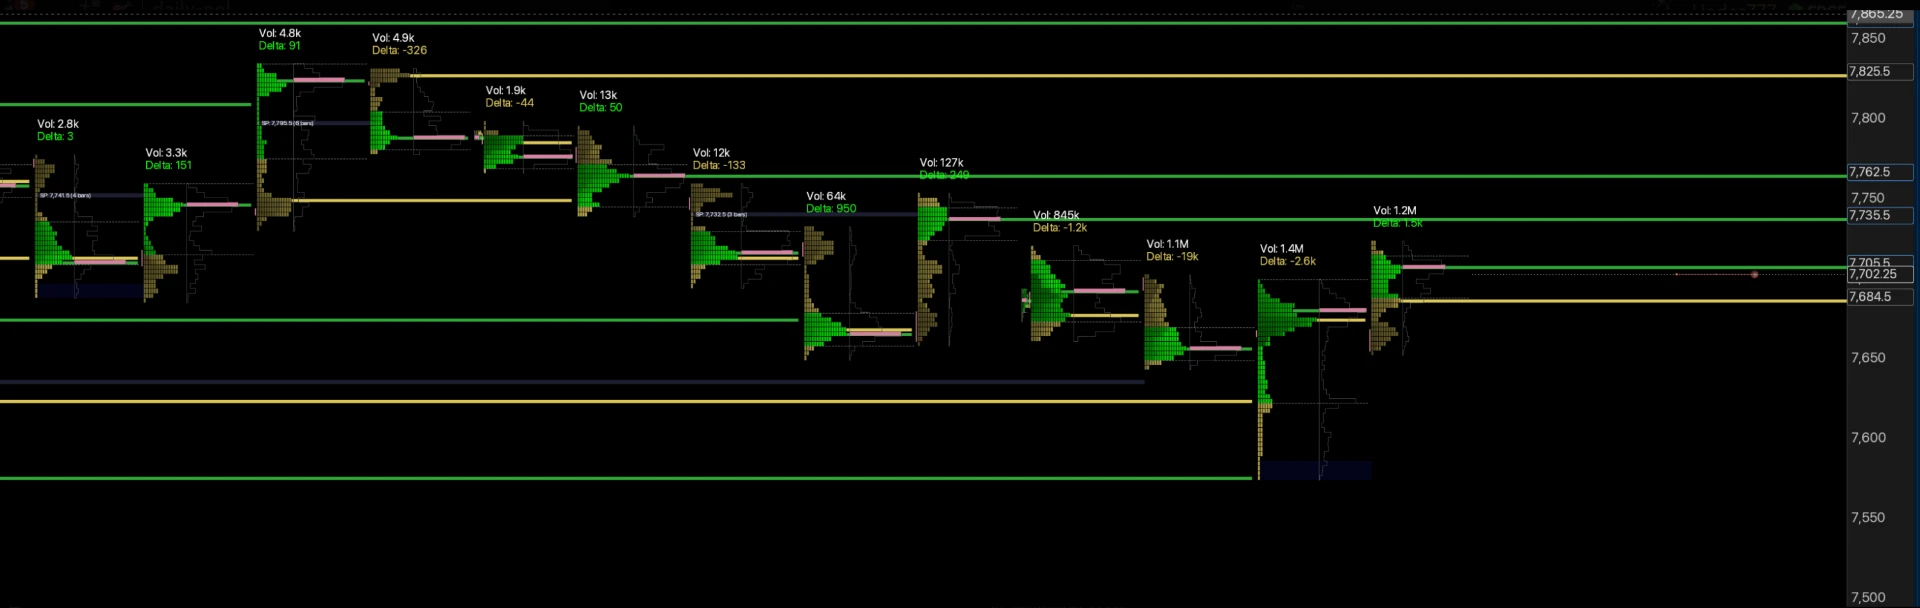
A volume profile groups traded volume by price over a selected period or range. It can highlight high-volume and low-volume areas, a point of control and a configured value area. It answers a different question from the vertical volume bars under a chart, which group activity by time or bar.
Use that map to assess where the market previously did business and how price behaves on a return. Do not equate historical traded volume with live resting liquidity. A high-volume node is not proof that a large order is currently waiting there.
The selected range changes the picture. A developing session profile, the previous session and a multi-session composite can each be legitimate while describing different contexts. Fix your selection rules so a level is not chosen only because it fits a trade you already want.
See volume profile trading and auction market theory for the location framework. These are generic analytical concepts; they should not be confused with a claim that my VIP level list consists of POC, VAH or VAL.
Cumulative delta and footprints: examine the response
Cumulative delta aggregates signed volume from a reset point. In a bid/ask implementation, ask-executed volume contributes positively and bid-executed volume negatively. It is a view of classified aggression—not a count of buyers minus sellers.
The useful comparison is effort against result. If aggressive buying increases while price cannot advance through a prepared area, investigate whether sell liquidity is absorbing it. If selling is strong and price keeps moving lower, do not call the move bullish just because the volume looks dramatic.
A footprint chart adds price-by-price detail. It can help you inspect where the trades occurred rather than rely on an aggregate line. Neither view identifies an institution or guarantees that an apparent absorption pattern will hold.
These tools deserve a data check before a strategy test. True bid/ask classification, tick-rule classification and lower-timeframe estimates do not necessarily produce the same readings. A platform displaying a delta label does not establish that its historical and live calculations match your intended method.
Moving averages: simplify trend, do not outsource entries
A simple moving average averages prices over its lookback; an exponential moving average gives greater weight to recent observations. Both transform past price. An EMA can respond more quickly to new prices, but that is not the same as predicting them.
Moving averages can provide a consistent way to describe trend alignment or pullback depth. Their weakness is the same consistency in a different environment: during a choppy range, price can cross them repeatedly and generate conflicting impressions.
A crossover system needs defined instruments, sessions, entries, exits and costs before you can judge it. There is no defensible universal “best EMA pair” for ES and NQ in this article. Popular settings are conventions, not evidence that a particular account will make money.
If you already read market structure clearly, ask whether the average adds information or merely draws a delayed version of what you see. Keep it when it makes a rule easier to execute; remove it when it becomes a reason to ignore price invalidation.
ATR: volatility belongs in risk planning
Average true range summarises recent true ranges, including the relationship with the previous close. It is directionless. A rising ATR describes larger recent movement, not a bullish market.
ATR can help you compare current conditions with quieter periods and recognise when an old stop distance may be inappropriate. It cannot choose a safe account risk by itself. The same volatility reading can correspond to a manageable trade on small size and an unacceptable trade on larger size.
Start with the price at which the setup is wrong. Then calculate the monetary risk for the instrument, stop distance and size, including costs. If a structurally sensible stop makes the trade too expensive, reducing size or skipping it is more coherent than tightening the stop just to satisfy an arbitrary ATR multiple.
The futures evaluation risk plan explains the account side. ATR is a volatility input; drawdown, daily stops and exposure remain separate constraints.
RSI and momentum tools: avoid the overbought trap
RSI summarises the relative strength of recent upward and downward price changes. It can help describe momentum or a weakening push within a tested setup. It is not a direct measure of resting liquidity or exchange buying aggression.
The common mistake is shorting simply because RSI is “overbought,” or buying simply because it is “oversold.” During persistent trends, extreme readings can continue while the market keeps travelling. A range-reversion interpretation is not automatically transferable to a trend day.
The same caution applies to stacking RSI, stochastic and other momentum transforms. Several tools agreeing can look persuasive, but they may be responding to overlapping price information. That is not the same as three independent confirmations.
If a momentum tool is part of your plan, define its role. Does it filter trades, describe context or supply an entry condition? A tool that changes jobs whenever a trade goes wrong is not a stable rule.
My actual ES and NQ toolkit is not an indicator bundle
I use Tradovate on my prop firm accounts, connected to TradingView for execution. ExoCharts is my orderflow analysis tool. Tradecopia copies my own lead-account trade to the other accounts. Those are different jobs, not seven interchangeable indicators competing for attention.
My TradingView preparation uses my own higher-timeframe and intraday ES/NQ liquidity areas. The level-mapping tutorial shows manual drawings, templates and groups. It does not install an automatic indicator or disclose a complete proprietary calculation.
I describe the level method as backtested over five years. That description is not a published win rate, a promise of future returns or proof that another trader will execute it identically. Do not substitute the length of a backtest for a defined trading process.
If you want that daily preparation, the Sato VIP page explains the ES/NQ levels, directional bias, setups and tutorials. VIP does not include an orderflow software licence; members control their own entries, confirmation and risk.
Want to simplify your chart setup 1:1?
In mentorship we review which tools change your decisions, how you confirm a trade and how you manage its risk. Mentorship also includes 12 months of Sato VIP. Limited spots.
Explore 1:1 MentorshipA beginner's futures chart: add tools one job at a time
A sensible learning sequence starts with price, the instrument and the session. Learn to distinguish a trend from a range, mark a location and identify invalidation. A simple session reference can then help make those observations more consistent.
Once that process is understandable, add one tool for one unresolved question. If you struggle with location, study a profile. If you understand locations but struggle to assess aggression there, explore delta or a footprint. If changing volatility surprises your risk plan, learn a range measure.
This is a learning sequence, not a rule that everyone must use the same chart. ES and NQ can share a framework while requiring different risk decisions. A chart that feels comfortable on ES does not justify carrying identical stops or position sizes over to NQ.
For chart aggregation choices, see tick, range and time charts. Changing the bars changes what an indicator consumes, so record the chart type alongside any settings you test.
How to test whether an indicator deserves space
- Write its job in one sentence. “It stops me taking a reversal idea while price is accepting above my area” is testable. “It makes me confident” is too vague.
- Keep a baseline. Review the same type of setup without the new filter. Otherwise every improvement gets attributed to the latest addition.
- Record skipped trades as well as taken ones. A filter can avoid losses while also removing valid opportunities. Both outcomes matter.
- Include practical costs. Commissions, slippage, feed requirements and extra decision time can change whether a tool is worthwhile.
- Test beyond the examples used to choose settings. A beautiful replay of familiar charts is not evidence that a filter generalises to unfamiliar conditions.
Watch for repainting or values that change after a bar closes. Historical appearance may not match what was available when a real decision had to be made. Understand that behaviour before using a screenshot as evidence of a tradable signal.
The final test is simplicity: can you explain why the tool is on the chart, what it changes and when it is irrelevant? If not, remove it until you can. The best futures indicator setup is the one you can interpret and test—not the one with the most coloured lines.
Last updated 2026-10-16. No software price, universal indicator setting or verified performance ranking is asserted. Check current platform documentation and data availability before choosing tools.
Build a Process Around Prepared Levels
Sato VIP gives you my daily ES & NQ map. Keep the tools you understand; entries, confirmation and risk stay under your control.
Daily preparation and context — not trade signals.
Futures trading indicators FAQ
What are the best indicators for futures trading?+
There is no universal winner. VWAP can provide a session reference, volume profile maps traded activity by price, cumulative delta describes classified aggression, moving averages summarise trend, and ATR describes volatility. Choose tools by the question they answer, not a claimed win rate.
What indicators should a beginner use for ES or NQ?+
Begin with price structure, a consistent session definition and a simple reference such as session VWAP. Add another tool only when you understand its data and can explain which decision it changes. Learning six indicators at once is not necessary.
Is VWAP the best indicator for futures scalping?+
VWAP can help frame intraday location, but a touch or cross is not a complete scalping setup. Trend, price response, execution costs, stop placement and position size still determine whether an idea is tradable.
Is RSI useful for futures trading?+
RSI can describe momentum within a defined strategy. An overbought reading is not automatically a short signal, and an oversold reading is not automatically a long signal. Strong trends can maintain extreme readings.
Do I need cumulative delta to trade futures?+
No. CVD is optional. It can help compare aggression with price progress, but requires a clear understanding of the feed, calculation and reset. A simpler process you can execute consistently is preferable to a tool you cannot interpret.
Are Sato's daily levels a TradingView indicator?+
No. The TradingView tutorial shows manually marked HTF and intraday ES/NQ liquidity areas. Sato VIP provides preparation, bias, setups and tutorials; it is not an automatic indicator or an orderflow software licence.
Can I use the same indicator settings on ES and NQ?+
You can compare the same analytical framework, but do not assume identical settings, thresholds or stop distances produce equivalent risk. The instruments have different price behaviour and contract values. Test the specific instrument and session.
How many futures indicators should I use?+
Use only enough to answer distinct questions. Location, confirmation and volatility are different roles; several momentum indicators may repeat the same information. Remove a tool if it never changes a planned decision.
Which futures indicator guarantees profitable trades?+
None. An indicator describes or transforms market data. Profitability requires a tested process, execution and risk control, and remains uncertain even with those in place.